I offer this post with apologies to mathematicians, gardeners, people who are picky about metaphors and logic, and M&M fans.
And spoiler alert, this is really about Black Lives Matter.
One of my favorite concepts in any kind of social science research project, or even in home dilemmas, is “raw numbers v. proportions within categories.” In the survey platform I often use it’s referred to as “counts v. percents.” Numbers are helpful when comparing groups, but we get to choose which numbers to use. For example, I could investigate how the plants in my garden are doing. Let’s say I buy 30 plants. I plant 10 ferns and 20 lilies. I then notice, 2 weeks later, that 8 ferns are thriving and 10 lilies are thriving. I could say “hey those lilies are doing better (because 10 is more than 8)!” Or I could say “hey those ferns are doing better (because 80% thriving is better than 50%)!” In any case I got 18 out of 30 thriving plants but I’d like more.
Where should I focus my energy? I think I’ll move those lilies to notch up that proportion.
Using raw numbers to compare groups may work for small sample sizes (e.g., I had 4 doughnuts yesterday and my husband had 2), or tasks where you don’t need to find the cause of a problem or make meaningful comparisons (no comment about the doughnut example…yet).
But using raw numbers to make my plant comparison can’t really account for disproportionate thriving, which is related to not being able to account for context that shapes outcomes. We can get to whether there is a difference between groups, but we can’t easily get to why there is a difference, how it came about, or what to do to change anything (oh, I get it now…my husband thought we should both have an equal proportion of the 6 doughnuts but I operated with the first come first served principle. Huh).
Anyway, back to the plants: in addition to missing context, comparisons of raw numbers can paint an inaccurate picture of my garden because the proportions of success within categories changed from planting to assessing two weeks later. The numbers emerge over time. If I want more plants to thrive I should take care of the category with the low proportion of thriving or my entire total probably won’t go up. I should use proportions within categories, not just raw numbers. The ferns mostly are fine, but the lilies mostly are not. I should figure out why. I can lament the loss of the ferns, too, by the way. Nobody wants loss. And I can certainly move them to change their context. But that won’t take as much space or effort. The overall idea is that the care for the lilies matters more as I decide what the next steps are to improve the category of “thriving” in my whole garden in the future. I should look at what happens over time and not just the present numbers with no context in order to make more plants thrive in the future.
More examples that I’m pondering:
Isn’t it hilarious that the first question I ask my son when he says “I got a 17 on my test and my friend got a 19” is something like “out of 20 or 100?” (Yes, yes, this is what I do every single time). Boom, grade context.
If you bought a Ford and your wife bought a Toyota locally, and before you decided whose was safer to drive, wouldn’t you want to know how many total Toyotas and Fords each were sold if you learned that 6 locally-sold Toyotas and 3 locally-sold Fords had deadly defects? Boom, safety context.
Will I ever get rid of my morbid curiosity to find out whether there were only 3 paper submissions total submitted the year I was one of 3 people who won a graduate student paper award at a national conference? (No, no I will not get rid of this curiosity, but I will never ask). Boom, measures of success context.
Wouldn’t it provide some helpful backstory to know the average incomes of rich people in your town to see if your asshole boss and your best friend’s asshole boss seem similar or different from each other in terms of how accurate it would be to say “no, my boss is a richer asshole than yours?” Boom, cost of living context.
Wouldn’t you want to know how many of each color of M&Ms are in a bag in order to figure out how much to celebrate when you blindly grab a green one and think it’s a super rare color? (which it’s not, nerds). Boom, candy context.
Wouldn’t you want to know how worried to be about the coronovirus in the county you’re planning to visit for a weekend camping trip by knowing more about how many people who show no symptoms actually have the virus, since comparing just the raw numbers of cases tested from county to county cannot tell the whole story and makes us doubt the value of numbers a little bit? Boom, COVID context.
And how about this: If you learned that 12 protesters were arrested in your city and 12 protesters were arrested in your cousin’s city, wouldn’t you want to know how many protesters were present at each protest to get a more accurate image of what that arrest scene may have looked like? Imagine the headline difference: “Town shaken: All but one arrested in the ‘bakers dozen doughnut protest’ in Smallville!” v. “Something finally went okay for once: Peaceful doughnut protest leads to a mere dozen arrests among thousands of sugar-fueled protesters desperately in need of milk.” Boom, (doughnut) protest context.
Aren’t proportions and denominators wonderful? And this is without even dabbling into the exciting world of statistical significance tests that get at legit group differences. And yes, we can still get it wrong if we use proportions if we choose the wrong denominator.
But generally speaking, I’d say it’s helpful to use proportions within categories to compare the thriving (and, okay, also the doughnuts).
Denominators, Denominators, We’re on the bottom!
Oh, and there is one more place where using proportions really can be a matter of life and death.
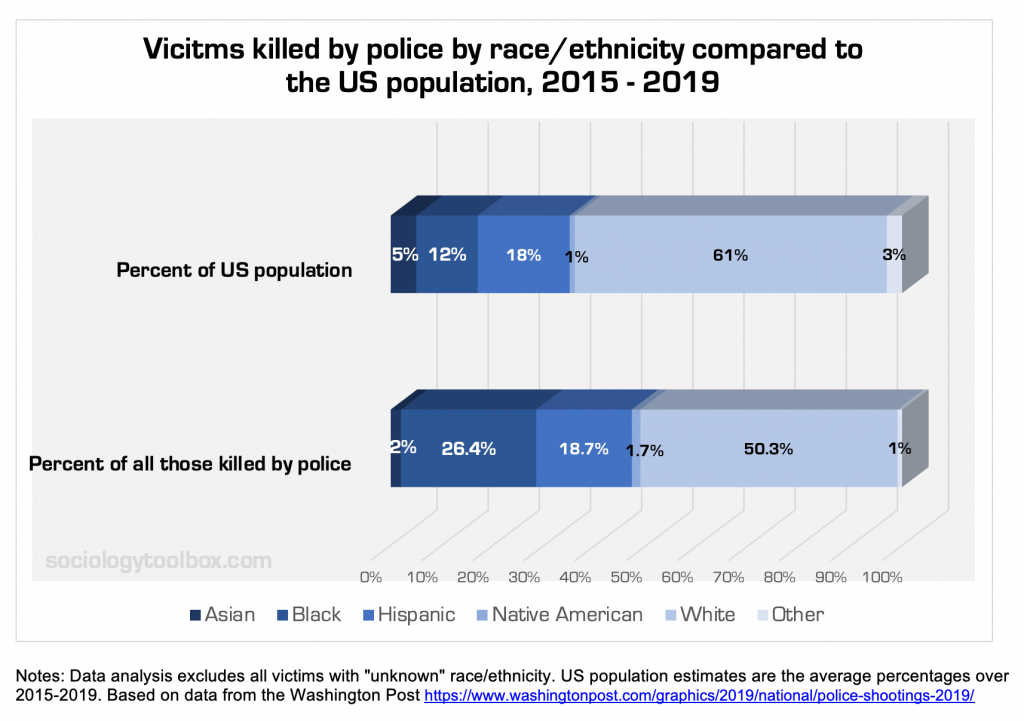
The authors of the linked article that includes this graphic use proportions well, and they present some progress alongside the grim: “In sum, the number of unarmed people killed by police declined after 2015. Arguably, with a well-trained police force, this number should be zero. While whites constitute both the highest number and percentage of those killed by police and those unarmed when killed by police, they also make up a majority of the population in the US (~60% non-Hispanic white in 2019). Blacks are disproportionately impacted by the use of lethal force by the police relative to the general population. Blacks continue to make up a disproportionate number of all those killed by police and the number of those that were unarmed when killed by police. If we look at the victims of police lethal force by race in 2019, a similar proportion of the whites, blacks, and Hispanics killed by police were unarmed when killed.”
Boom, race is THE context.
